Collecting Netlify Analytics data with Python
As you can see here, Netlify Analytics only spans the past 30 days:
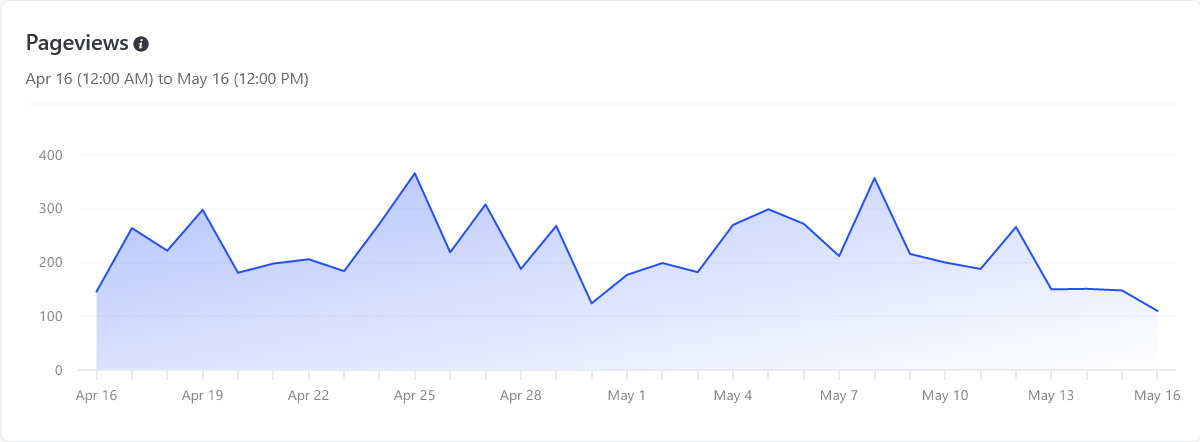
This could easily be solved if we could download the data and retain it ourselves. However, there is no way in the Netlify Analytics UI to download the data.
But what if we take a look under the hood?
Browser developer tools §
Still on the Netlify Analytics page, let’s fire up the Firefox developer tools and take a look at the network tab:
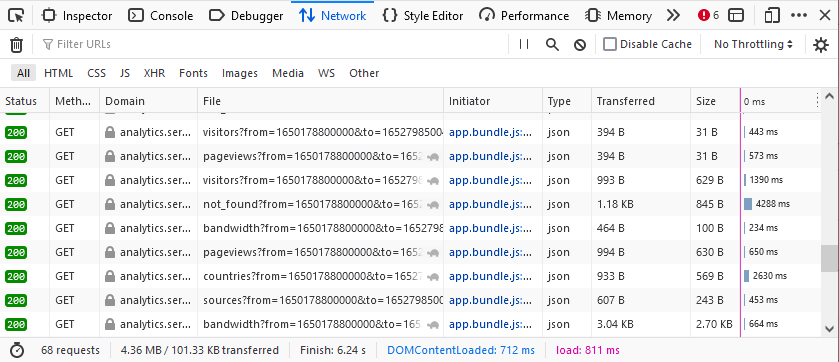
Let’s take a look at the pageviews request:
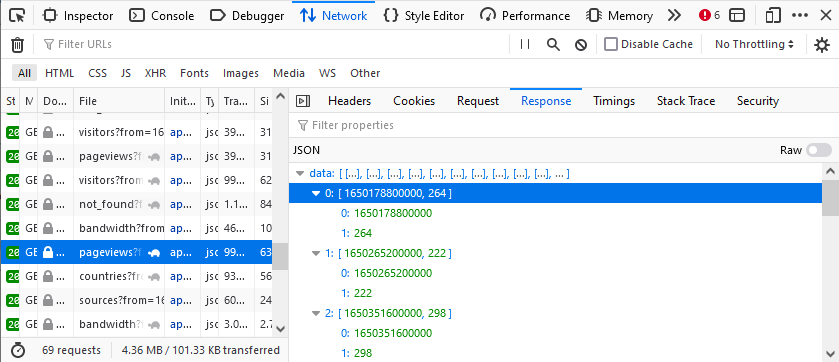
By viewing the network requests, we can see the data we want is just raw JSON. We could just download this manually, but that’s going to get old fast. We want to automate this.
Netlify API §
To help with automation, Netlify offer an API, which lets you do all sorts of things, but yet analytics is mysteriously absent.
Or is it?
While not officially supported, the endpoints we discovered above work in just the same manner as the rest of the officially supported API!
Generate a personal access token §
First, you will need to generate a “personal access token”. Checkout the Netlify docs for the details.
In short, go to: Netlify → User Settings → Applications → Personal access tokens → New access token. Or click here if you’re already logged in to Netlify.
Get your site ID §
Second, you will need your site ID, which is a UUID that identifies your site. It can be found in the Netlify UI under “Site settings”.
Using curl to download Netlify Analytics pageviews §
With our token and site ID, now we can run curl to download the pageviews JSON data. Replace <TOKEN> with your personal access token, and <SITE_ID> with the site ID:
curl -o pageviews.json -H "Authorization: Bearer <TOKEN>" https://analytics.services.netlify.com/v2/<SITE_ID>/pageviews?from=1649804400000&to=1652405014112&timezone=%2B0100&resolution=dayIn pageviews.json we can see the raw data:
{
    "data": [
        [1649894400000, 8],
        [1649980800000, 359],
        [1650067200000, 190],
        [1650153600000, 272],
        [1650240000000, 168],
        [1650326400000, 337],
        [1650412800000, 182],
        [1650499200000, 197],
        [1650585600000, 181],
        [1650672000000, 196],
        [1650758400000, 253],
        [1650844800000, 368],
        [1650931200000, 252],
        [1651017600000, 237],
        [1651104000000, 264],
        [1651190400000, 189],
        [1651276800000, 210],
        [1651363200000, 154],
        [1651449600000, 195],
        [1651536000000, 187],
        [1651622400000, 240],
        [1651708800000, 334],
        [1651795200000, 261],
        [1651881600000, 221],
        [1651968000000, 358],
        [1652054400000, 214],
        [1652140800000, 192],
        [1652227200000, 191],
        [1652313600000, 233],
        [1652400000000, 210],
        [1652486400000, 142],
        [1652572800000, 143],
        [1652659200000, 174]
    ]
}
Note that you will need to adjust the to and from timestamp. They are both unix timestamps in milliseconds, not seconds (i.e. unix time * 1000). The value of from should be smaller than to. The maximum range is 30 days.
Using Python to download Netlify Analytics pageviews §
As a quick-and-dirty example, here is the same wrapped up Python script called gather_analytics.py, which automatically calculates the timestamp range:
import sys
import requests
import datetime
import pprint

# Usage: gather_analytics.py <SITE_ID> <TOKEN>
def main():
    site_id = sys.argv[1]
    token = sys.argv[2]

    # Get current UTC date, e.g. 2022-05-16.
    date_utc = datetime.datetime.utcnow().date()

    # Convert to unix timestamp in milliseconds.
    timestamp_to = int(datetime.datetime(
        year=date_utc.year,
        month=date_utc.month,
        day=date_utc.day,
    ).timestamp() * 1000)

    # Calculate unix timestamp in milliseconds 30 days prior.
    timestamp_from = timestamp_to - (30 * 24 * 60 * 60 * 1000)

    # Use pprint to improve readability.
    pprint.pprint(gather_pageviews(site_id, token, timestamp_from, timestamp_to))

def gather_pageviews(site_id, token, timestamp_from, timestamp_to):
    url = f"https://analytics.services.netlify.com/v2/{site_id}/pageviews?from={timestamp_from}&to={timestamp_to}&timezone=%2B0100&resolution=day"
    response = requests.get(url, headers={"Authorization": f"Bearer {token}"})

    if response.status_code != 200:
        print(f"ERROR: got response {response.status_code}")
        return None

    return response.json()

if __name__ == "__main__":
    main()
For example:
$ python gather_analytics.py <SITE_ID> <TOKEN>
{'data': [[1650063600000, 189],
          [1650150000000, 270],
          [1650236400000, 168],
          [1650322800000, 334],
          [1650409200000, 182],
          [1650495600000, 192],
          [1650582000000, 188],
          [1650668400000, 198],
          [1650754800000, 254],
          [1650841200000, 362],
          [1650927600000, 256],
          [1651014000000, 233],
          [1651100400000, 262],
          [1651186800000, 196],
          [1651273200000, 211],
          [1651359600000, 145],
          [1651446000000, 200],
          [1651532400000, 191],
          [1651618800000, 223],
          [1651705200000, 340],
          [1651791600000, 266],
          [1651878000000, 215],
          [1651964400000, 369],
          [1652050800000, 213],
          [1652137200000, 188],
          [1652223600000, 194],
          [1652310000000, 229],
          [1652396400000, 218],
          [1652482800000, 139],
          [1652569200000, 145],
          [1652655600000, 58]]}
Conclusion §
All that remains is to runs this periodically, and zip all the data together.
Further steps §
Endpoints §
By inspecting the network requests in the developer tools further, we can find that there are endpoints for other data besides pageviews:
f"https://analytics.services.netlify.com/v2/{site_id}/bandwidth?from={timestamp_from}&to={timestamp_to}&timezone=%2B0100&resolution=day"
f"https://analytics.services.netlify.com/v2/{site_id}/ranking/countries?from={timestamp_from}&to={timestamp_to}&timezone=%2B0100"
f"https://analytics.services.netlify.com/v2/{site_id}/ranking/not_found?from={timestamp_from}&to={timestamp_to}&timezone=%2B0100&limit=15"
f"https://analytics.services.netlify.com/v2/{site_id}/ranking/pages?from={timestamp_from}&to={timestamp_to}&timezone=%2B0100&limit=15"
f"https://analytics.services.netlify.com/v2/{site_id}/pageviews?from={timestamp_from}&to={timestamp_to}&timezone=%2B0100&resolution=day"
f"https://analytics.services.netlify.com/v2/{site_id}/ranking/sources?from={timestamp_from}&to={timestamp_to}&timezone=%2B0100&limit=6"
f"https://analytics.services.netlify.com/v2/{site_id}/visitors?from={timestamp_from}&to={timestamp_to}&timezone=%2B0100&resolution=range"
This could allow us to gather other types of analytics data, and also illustrates some possible filters such as resolution.
More reading and resources §
Other people have already had a similar idea. Check out these related projects:
- A GitHub Action that automates fetching the analytics data every day and storing it in a Google Sheet.
- The GitHub repo for the action.
- A Netlify stats viewer in Vue.js.
- The GitHub repo for the stats viewer.
- A clever example of using the
pagesendpoint to automatically generate a “Popular This Month” section of the blog.